| Статистика |
Онлайн всего: 1 Гостей: 1 Пользователей: 0 |
|
The SNMP Trap/Monitor program is used for monitoring (continuous polling in a given time period) the ports of the network communicators (switch) and the trap of the SNMP notifications (trap), version 2.
The program is based on Qt 5 (qt-project.org), net-snmp 5.7.2 (www.net-snmp.org), RRDTool (oss.oetiker.ch/rrdtool).
The program is supplied for the 32-bit and 64-bit versions of Windows (in case you are interested, it is possible to send you the files for Linux).
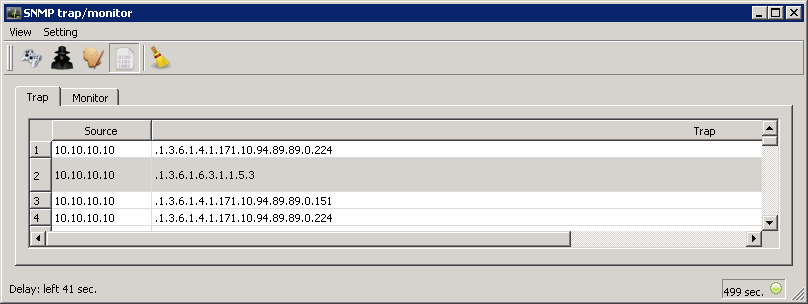
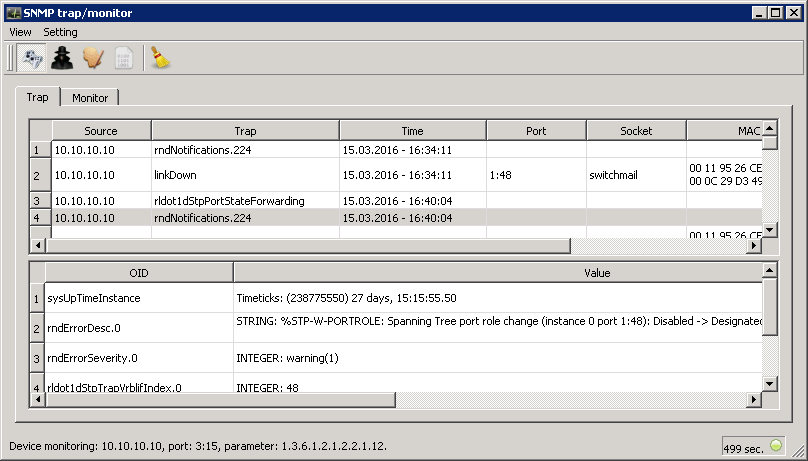
The “Trap” tab starts working immediately and accepts notifications from all the devices that have their trap sending address configured.
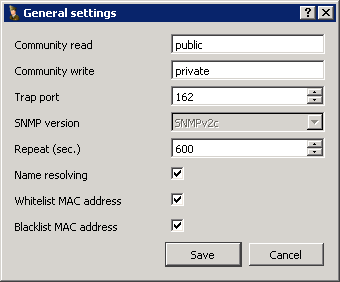
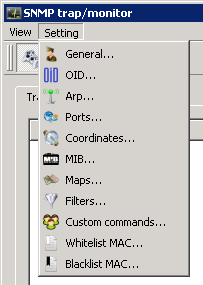
In the “Settings | General” menu
it is possible to change the Community for reading or writing; the port where the program receives traps; only Version 2 of SNMP is supported; the polling period for monitoring and resolving of IP addresses to the names; turn on checking of the white and black lists of MAC. The settings of this window are saved in the setting.txt file is located next to the program. This is a text file with a «=» divider.
 community_read=public
 community_write=private
 port_trap=162
 version_snmp=SNMP_VERSION_2c
 pollperiod=60
 resolving_name=true
 check_mac_white_list=false
 check_mac_black_list=false
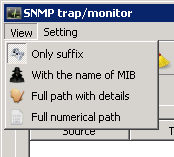
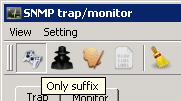
In the “View” menu or on the “Control Panel” or in the contextual menu with the selected “Trap” tab
it is possible to select the trap expression: “Suffix Only”
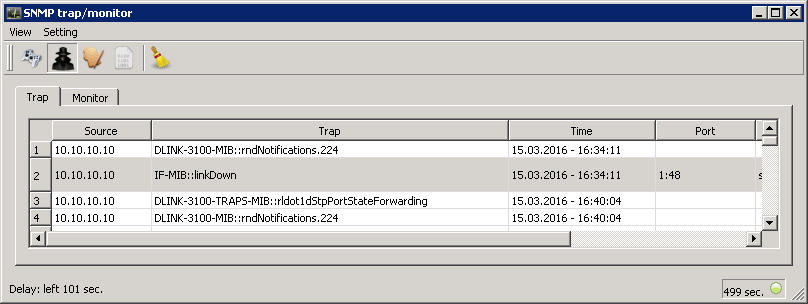
“With MIB name”
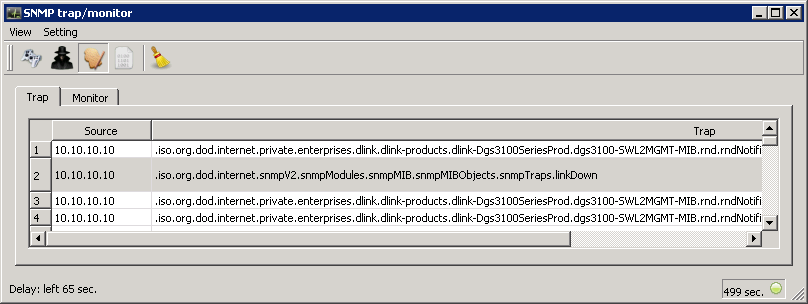
“Full path with expansion”
“Full digital path”
There is also a button to clear the table.
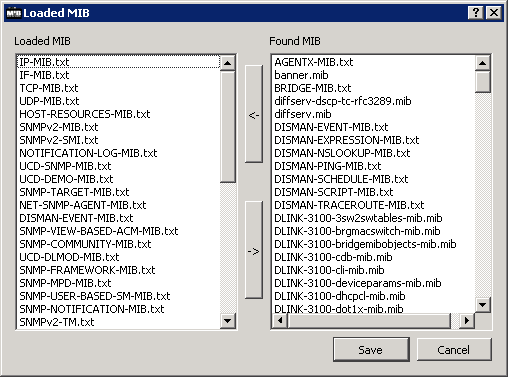
The representation is influenced by the following program settings (“Settings|MIB…”)
Several basic MIB files are supplied with the program; they are located in the mibs folder. All files found in the folder are shown on the right side. MIB files that will be used in Trap representation are shown on the left side. You can move MIB from the right to the left by clicking <- or -> buttons. This window’s settings are saved in loadmib.txt file located next to the program. This is a text file with MIB list:
 IP-MIB.txt
 IF-MIB.txt
 TCP-MIB.txt
 UDP-MIB.txt
 HOST-RESOURCES-MIB.txt
 SNMPv2-MIB.txt
 SNMPv2-SMI.txt
No checking is done with this file.
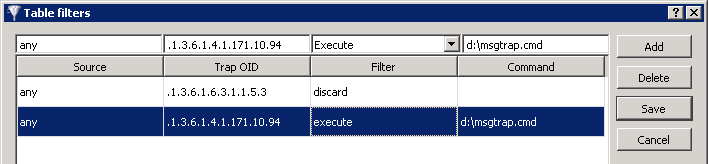
The trap representation is also influenced by the “Settings|Filters” menu (Picture 9). When you press it “Filters Table” dialog box pops up
where you can set what to do – to “Execute” the command or “Discard” – with the trap. You can put an IP address or the word “any” for any trap source in the “Source” field. Put the OID trap, which starts from a dot, in the “OID Trap” field. Put “Discard” or “Execute” in the “Filter” field. Specify the command that is executed by arrival of this trap in the “Command” field (only for “Execute”). The settings of this trap are saved in the filters.txt file located next to the program. This is a text file with a «,» divider:
 any,.1.3.6.1.4.1.171.10.94.89.89.0.151,discard,
 any,.1.3.6.1.4.1.171.10.94.89.89.0.205,execute,d:\msgtrap.cmd
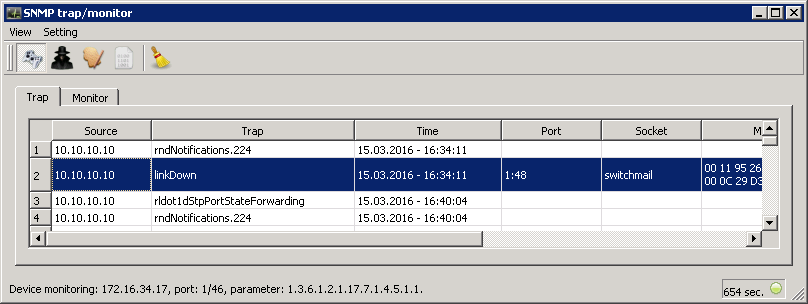
If you select any line in the trap table, the table with more detailed information about this trap will appear below.
You can hide the lower table by drawing the anchor point of the border between the two tables.
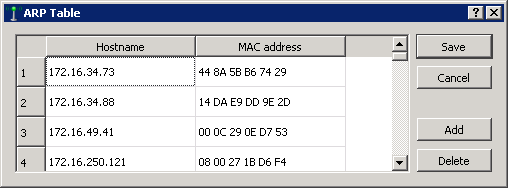
If the trap contains information about the physical port of the source the information about MAC, IP, DNS equipment connected to this port can be shown in the table. The “Socket” field is only a notice about this port; for me it serves as an indicator of the socket in CKC to which the data terminal equipment is connected. Correspondence between MAC and IP is verified by the operation system polling or by taking information from the arp.txt file located next to the program. This is a text file with a – space divider:
 192.168.1.1 00-1f-d0-12-59-fc
 192.168.1.2 00-c0-b7-44-0b-8d
This file can be viewed / edited by selecting the “Settings|Arp” menu (Picture 9) where you can set this correspondence.
No checking is done with these fields.
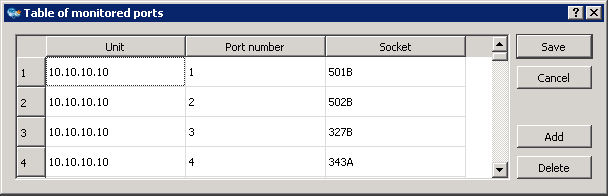
Correspondence of source ports in the “Socket” is set in the “Settings | Ports” menu (Picture 9). “Controlled ports table”dialog box will appear there.
You have to put IP address of the controlled device in the “Device” field and put port number of the controlled device in the “Port Number” field accordingly. Put any description of this port in the “Socket” field (for me this field serves for description of the CKC socket number). No checking of the input data is done. When pressing “Save” button the data is saved in the controlports.txt file located in the folder with the exe file of the program. This is a text file with a «,» divider:
 10.10.10.10,158,545A
 10.10.10.10,159,561B
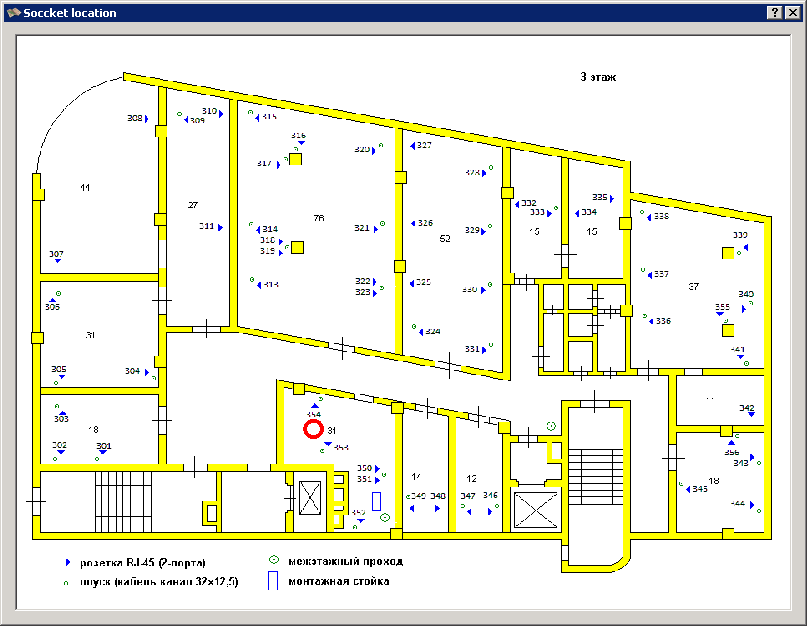
If there is a “Socket” field, double-click the trap line or select the contextual menu “Show Map” – and the “Socket Location” window will open (a building plan or whatever you like).
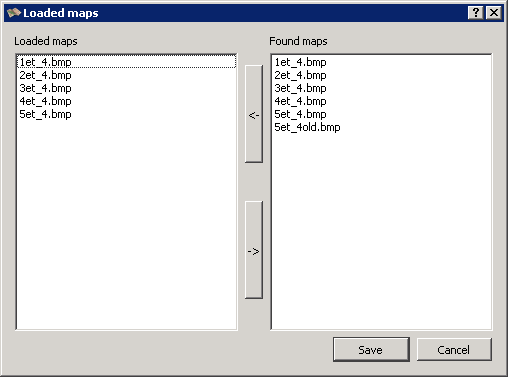
In order to realize this functional you have to load graphic files in the “Settings | Maps” menu (Picture 9).
The right side shows files with “.bmp” extension located next to the program; the left side shows the images used by the program in order to index them. You can move file names from the right to the left with <- or -> buttons. Settings of this window are saved in the maplist.txt file located next to the program. This is a text file with the image list.
 1et_4.bmp
 2et_4.bmp
 3et_4.bmp
 4et_4.bmp
 5et_4.bmp
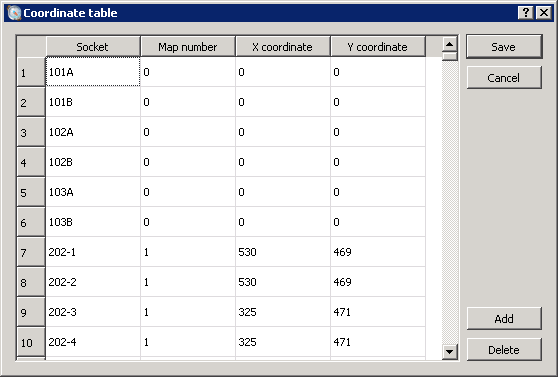
Then you have to open “Settings | Coordinates” menu (Picture 9)
and to fill in appropriate fields for each “Socket” (description). The settings for this window are saved in the socketmap.txt file located next to the program. This is a text file with a «,» divider:
 202-1,1,530,469
 202-2,1,530,469
 202-3,1,325,471
 202-4,1,325,471
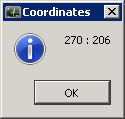
You can get the location coordinates by double-clicking the “Socket Location” window (Picture 15).
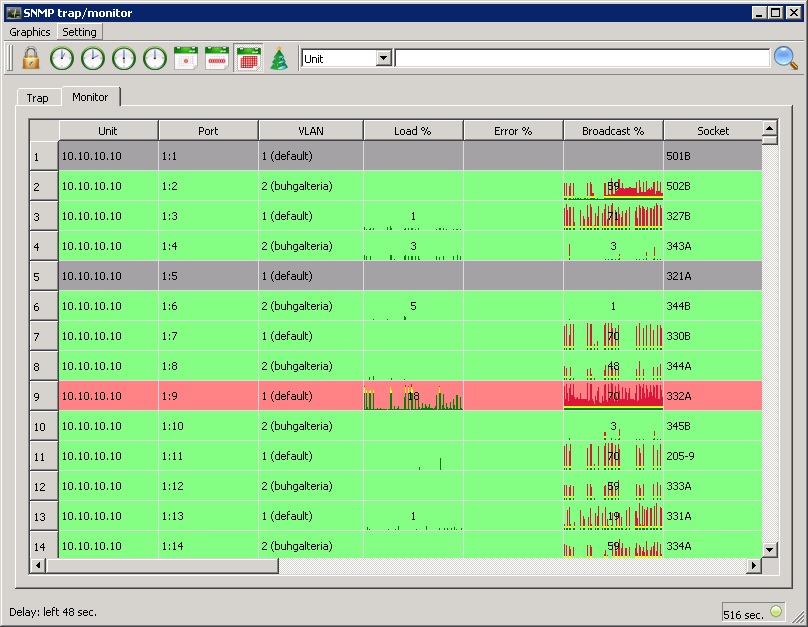
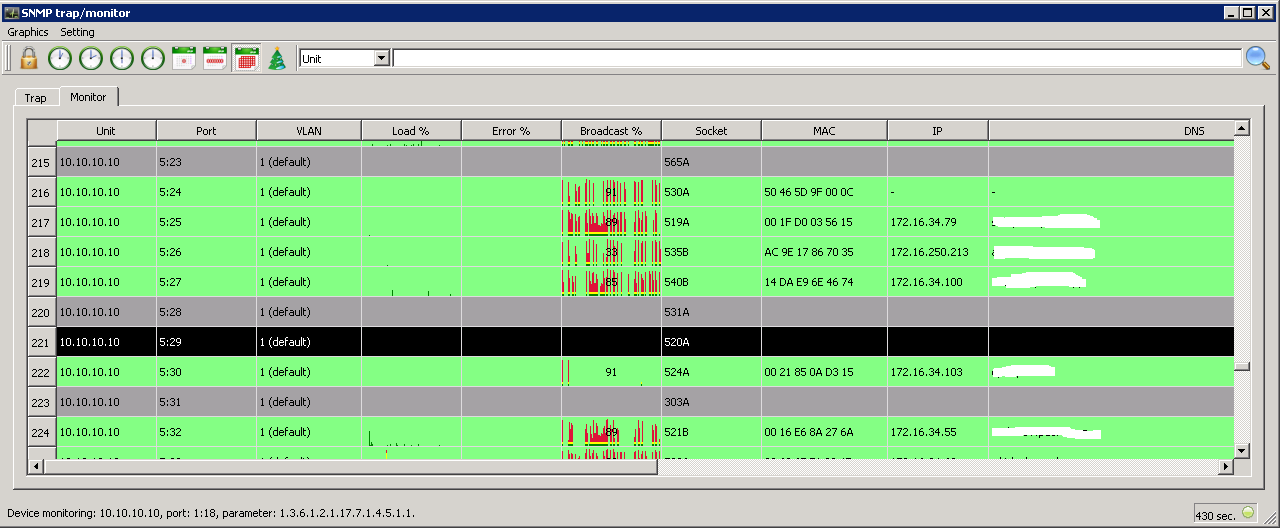
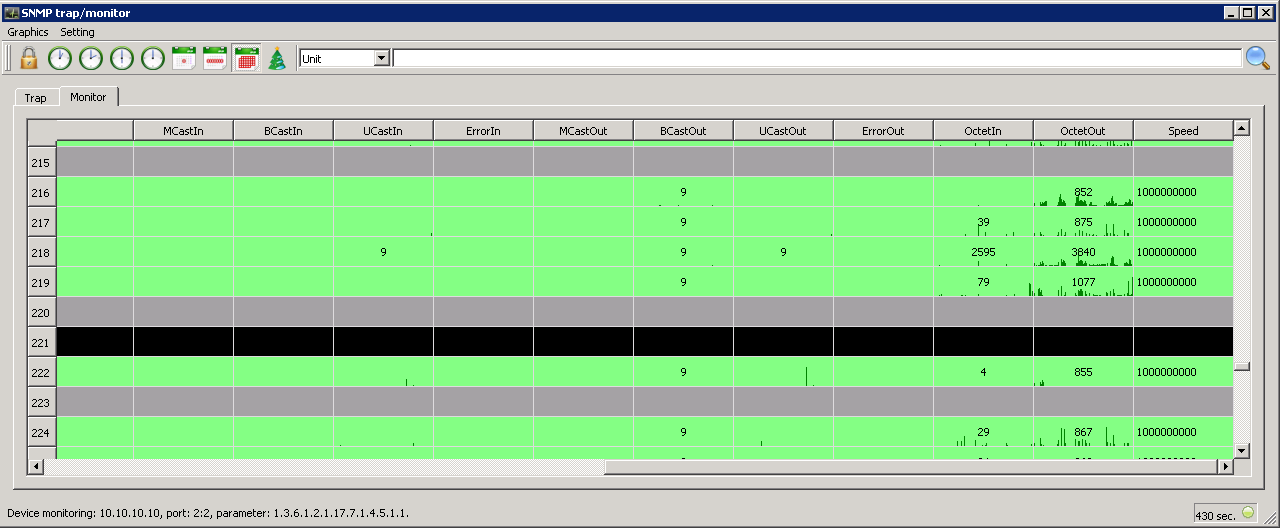
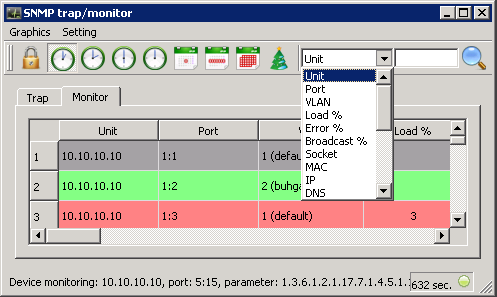
The “Monitor” tab
You have to fill in the aforementioned “Controlled Ports Table” for monitoring. After that, the program has to be restarted.
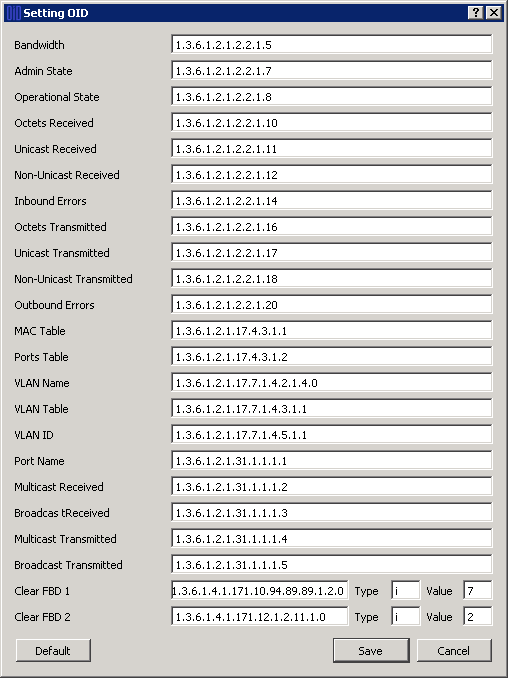
Then the program will call the device port by “Settings | OID” parameters by the SNMP protocol in accordance with the parameters indicated in the “Settings | General” menu and interval set in the same place.
In the appeared window parameters for monitoring and for clearing FDB table for two devices are listed. These settings are saved in the oid.txt file located next to the program. This is a text file with a «=» divider:
 oidSpeed=1.3.6.1.2.1.2.2.1.5
 oidAdmin=1.3.6.1.2.1.2.2.1.7
 oidOper=1.3.6.1.2.1.2.2.1.8
This dialog also allows returning to the “Default” settings by clicking the corresponding button.
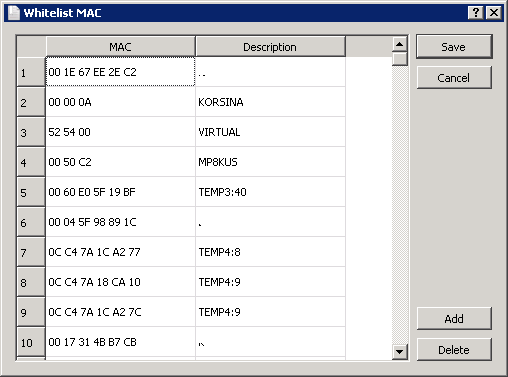
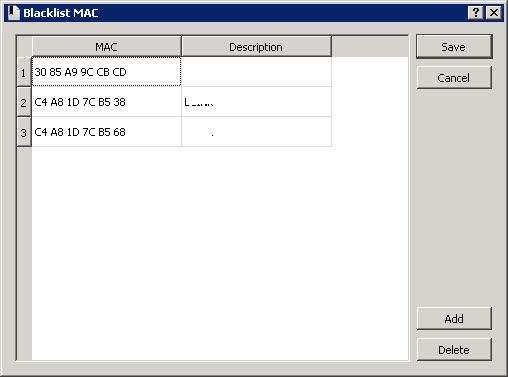
There is a white list and a black list of MAC to control the connected devices; their settings can be opened from the “Settings | MAC white list” and “Settings | MAC black list” menus (Picture 9).
These settings are saved in the macwhitelist.txt and macblacklist.txt files located next to the program. These are text files with a «,» divider:
 30-85-A0-9C-CB-CD,des1
 C4-A8-11-7C-B5-38,des2
 C4-A8-12-7C-B5-68,des3
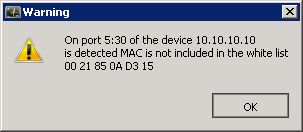
The description field is not processed anywhere - this is just a reminder for you. If corresponding MAC entry is found in the black list or is not found in the white list during half of the evaluation period, a window with a warning will appear.
When the program is launched the first run of the program will just be remembered while table management functions and the context menu are disabled. There will be a red indicator visible at the right bottom corner of the program screen. After the second run the indicator will turn green and the disabled functions will be enabled and the actual time of the run will be shown next to the indicator. When you are setting the evaluation period in the “Settings | General” menu it has to be based on this time shown. This setting requires restarting of the program since the file name for each port is created in the stat file based on it. These are RRD files serving as the basis for the history of changes of characteristics of this port.
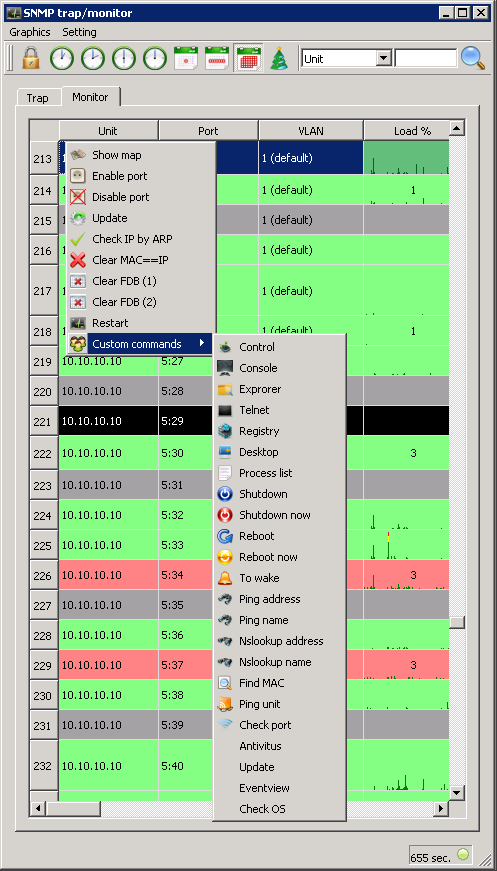
The ports that are turned off are shown in black, the ports that are turned on but have nothing connected to them are shown in grey, those with a load exceeding certain limits are shown in yellow, and the normal ones are shown in green. The fields that can have a history reflect changes in the given characteristic. History management is done through the control panel.
The interval can be selected as “do not show”, “1 hour”, “2 hours”, “6 hours”, “12 hours”, “24 hours”, “week”, “month”, and “year”.
Besides, the MAC field can be highlighted in red if the device has a port with the same MAC address. Or it can be highlighted in blue if there is more than one MAC at the port (not counting virtual machines).
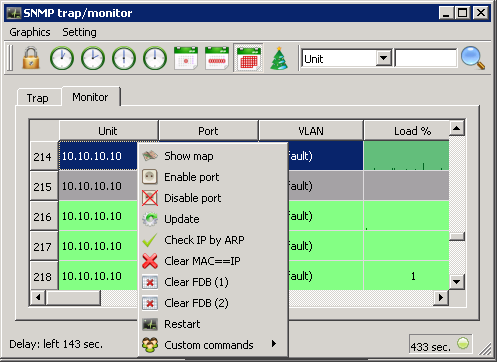
In the context menu
You can select “Show Map” - its settings and functioning are described above. “Turn on / Turn off port”. “Refresh” removes the history and scan port’s characteristics anew. “Check IP by ARP” may be needed due to monitoring intervals. The program stores MAC and IP that can result in discrepancy. “Clear FDB” clears FDB devices. “Restart” restarts monitoring cycle.
User commands - custom submenu.
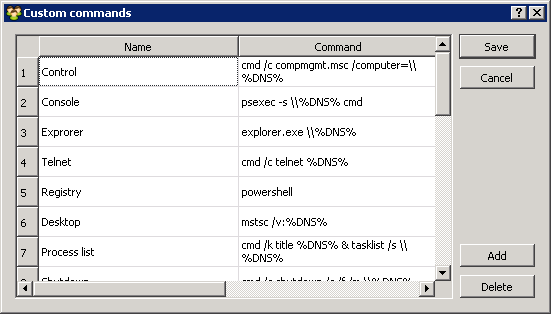
The setting is called from the “Settings | User Commands” menu (Picture 9)
Settings of this window are saved in the custom.txt file located next to the program. This is a text file with a «==» divider. Modifiers %DNS%, %IP%, %MAC:%, %MAC-%, %MAC %, %UNIT%, %PORT% can be used in the “Command” column. Their values will be taken from the monitored port line. The item icons are located next to the program. Their format is “number_menu.png”.
You can search by any column in the control panel.
The table can be sorted by any column. Each cell can be enlarged / reduced both in the horizontal and vertical dimensions. Sorting and changing horizontal dimensions require some time as many table components get redrawn. This is especially noticeable if the history period is long.
The status line tells what the program is doing at the moment.
|
|
| Календарь |
| « Апрель 2024 » | | Пн | Вт | Ср | Чт | Пт | Сб | Вс | | 1 | 2 | 3 | 4 | 5 | 6 | 7 | | 8 | 9 | 10 | 11 | 12 | 13 | 14 | | 15 | 16 | 17 | 18 | 19 | 20 | 21 | | 22 | 23 | 24 | 25 | 26 | 27 | 28 | | 29 | 30 |
|
|